
Short answer: to convert ppm to EC, divide the ppm reading by the scale your meter uses. On the 500 scale (also called TDS or NaCl), EC = ppm ÷ 500, so 1,000 ppm is EC 2.0 mS/cm. On the 700 scale (KCl), EC = ppm ÷ 700, so the same 1,000 ppm is only EC 1.43. That gap is why a ppm to EC conversion always starts with one question: which scale produced the number?
Most feed charts, nutrient labels and forum posts mix ppm and EC freely, and the numbers only line up once you know the scale behind each one. This guide gives the formulas, a ppm to EC table for all three common scales, and the two things that quietly change a reading: temperature and calibration. The figures come from the U.S. Geological Survey, North Dakota State University Extension, Oklahoma State University Extension, Cornell’s hydroponic lettuce program and the meter maker Bluelab.
Table of Contents
PPM to EC formulas
A pen that shows “ppm” is not counting dissolved particles. It measures electrical conductivity and multiplies it by a fixed factor. NDSU Extension explains that the meter “calculates an estimate of TDS by multiplying the EC reading with a conversion factor,” and that factors used across instruments range from 0.50 to 0.82. So every ppm to EC conversion simply reverses that multiplication.
| You have | You want | Formula | Example |
|---|---|---|---|
| ppm (500 scale) | EC (mS/cm) | ppm ÷ 500 | 800 ppm → EC 1.6 |
| ppm (650 scale) | EC (mS/cm) | ppm ÷ 650 | 800 ppm → EC 1.23 |
| ppm (700 scale) | EC (mS/cm) | ppm ÷ 700 | 800 ppm → EC 1.14 |
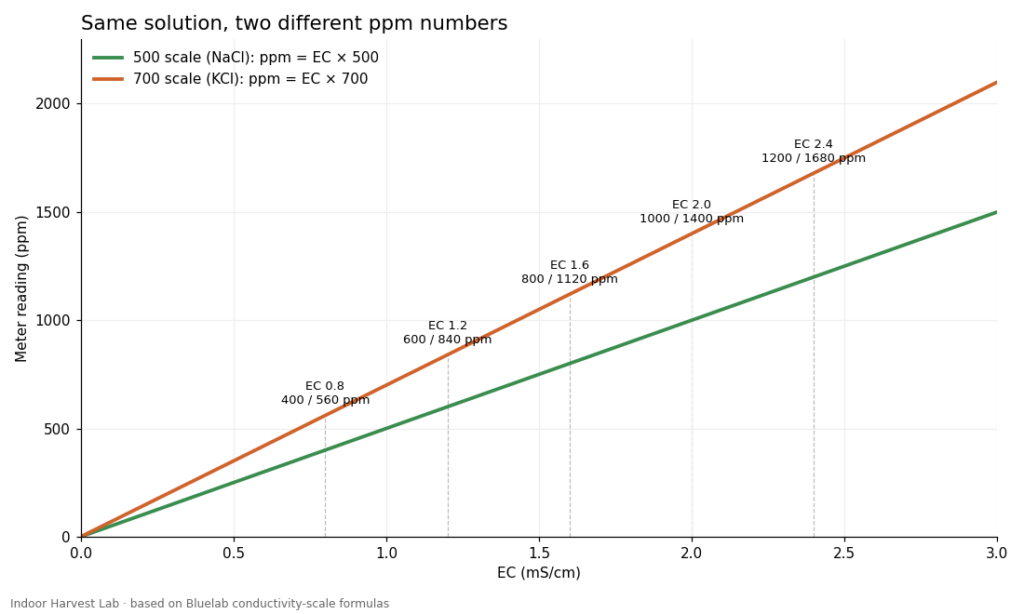
| EC (mS/cm) | ppm (500 scale) | EC × 500 | EC 1.6 → 800 ppm |
| EC (mS/cm) | ppm (700 scale) | EC × 700 | EC 1.6 → 1,120 ppm |
| EC (mS/cm) | µS/cm | EC × 1,000 | EC 1.6 → 1,600 µS/cm |
| EC (mS/cm) | CF | EC × 10 | EC 1.6 → CF 16 |
Units that look different are often identical. NDSU notes that 1 mS/cm equals 1 mmho/cm, and 1,000 µS/cm; 1 dS/m is also the same as 1 mS/cm, which is why the University of Missouri Extension can quote water-quality EC in dS/m while hydroponic charts use mS/cm. CF, the “conductivity factor” mentioned in Oklahoma State’s EC and pH guide, is EC multiplied by 10 to drop the decimal point.
PPM to EC conversion table
Use this ppm to EC table when a recipe or nutrient label gives ppm and you want to set a meter that reads EC. Find the ppm in the left column, then read across under the scale the recipe was written in.
| ppm reading | EC if 500 scale | EC if 650 scale | EC if 700 scale |
|---|---|---|---|
| 200 | 0.40 | 0.31 | 0.29 |
| 300 | 0.60 | 0.46 | 0.43 |
| 400 | 0.80 | 0.62 | 0.57 |
| 500 | 1.00 | 0.77 | 0.71 |
| 600 | 1.20 | 0.92 | 0.86 |
| 700 | 1.40 | 1.08 | 1.00 |
| 800 | 1.60 | 1.23 | 1.14 |
| 900 | 1.80 | 1.38 | 1.29 |
| 1,000 | 2.00 | 1.54 | 1.43 |
| 1,200 | 2.40 | 1.85 | 1.71 |
| 1,400 | 2.80 | 2.15 | 2.00 |
| 1,600 | 3.20 | 2.46 | 2.29 |
| 2,000 | 4.00 | 3.08 | 2.86 |
And the reverse, for when a chart gives EC and your meter only shows ppm:
| EC (mS/cm) | µS/cm | CF | ppm 500 | ppm 650 | ppm 700 |
|---|---|---|---|---|---|
| 0.8 | 800 | 8 | 400 | 520 | 560 |
| 1.0 | 1,000 | 10 | 500 | 650 | 700 |
| 1.2 | 1,200 | 12 | 600 | 780 | 840 |
| 1.4 | 1,400 | 14 | 700 | 910 | 980 |
| 1.6 | 1,600 | 16 | 800 | 1,040 | 1,120 |
| 1.8 | 1,800 | 18 | 900 | 1,170 | 1,260 |
| 2.0 | 2,000 | 20 | 1,000 | 1,300 | 1,400 |
| 2.5 | 2,500 | 25 | 1,250 | 1,625 | 1,750 |
| 3.0 | 3,000 | 30 | 1,500 | 1,950 | 2,100 |
For the EC each crop actually needs, pair this ppm to EC table with our hydroponic EC chart for 20 food crops.
Why ppm to EC depends on the scale: 500, 650 and 700
Each scale assumes a different salt is dissolved in the water. Bluelab describes the 500 scale as based on sodium chloride (NaCl), and says it is also called TDS; the 700 scale is based on potassium chloride (KCl); and a third, 650 scale is also in use. According to the same article, a book written in the USA could use the 500 or 650 scale, one from the UK the 700 scale, and one from Australia any of the three.
None of these is the “true” ppm of your nutrient solution. The USGS field manual on specific conductance states plainly that there is no universal linear relation between total dissolved substances and conductivity, and Bluelab adds that the true ppm of a solution can only be determined by chemical analysis. A hydroponic solution rich in nitrate, potassium and calcium does not behave like table salt, so a ppm figure is a convenient label, not a measurement.
That is the strongest argument for thinking in EC. EC is what the probe measures, it is the same number on every meter, and it is the unit extension services use in their recommendations.
How to tell which scale your meter uses
Knowing the scale is most of the work in any ppm to EC conversion. Four quick checks settle it.
- Check the settings and the manual. Many pens let you choose ppm 500, ppm 650 or ppm 700, or show “TDS” (usually the 500 scale). The setting is often hidden behind a long button press.
- Test a calibration standard. Bluelab’s conductivity standard is EC 2.77. On a meter set to ppm, a correctly calibrated 500-scale meter should read about 1,385 ppm, a 650-scale meter about 1,800 ppm, and a 700-scale meter about 1,939 ppm.
- Compare with an EC meter. Measure the same solution in EC and in ppm, then divide ppm by EC. A result near 500, 650 or 700 tells you the scale.
- Write it on the pen. A strip of tape reading “ppm 500” saves every future ppm to EC conversion from guesswork.
Step by step: ppm to EC for a feed chart
- Find the scale of the chart. Look for “TDS”, “NaCl”, “KCl”, “500”, “650” or “700” in the chart’s small print, or check where the brand or book comes from.
- Divide by that factor. A chart asking for 840 ppm on the 700 scale means EC 1.2 mS/cm; the same 840 on the 500 scale would mean EC 1.68.
- Measure your source water first. Tap water already carries salts. Missouri Extension treats EC 0.2–0.8 dS/m as a suitable range for source water, and Cornell’s Hydroponic Lettuce Handbook tells growers to subtract the base EC of their source water from the sensor reading. Its lettuce target is written as 1,150–1,250 µS/cm above the source water.
- Mix, stir, then read. Add nutrients in stages and re-measure after the solution has mixed; with a pump running, a few minutes is usually enough.
- Adjust EC before pH. Oklahoma State advises checking pH only after EC is in range, because adding fertilizer changes pH. Our guide on how to lower pH in hydroponics covers that second step.
Temperature: the hidden error in every ppm to EC reading
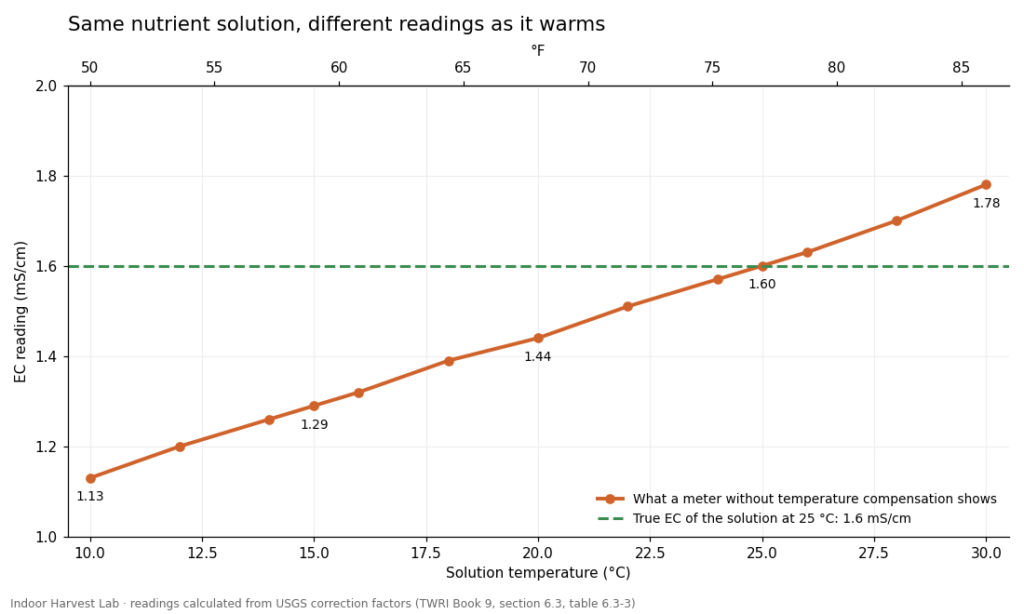
Conductivity rises as water warms, even when nothing is added. That is why the USGS reports conductivity “at 25 degrees Celsius” and why good meters have automatic temperature compensation (ATC). For meters without it, the USGS gives a correction equation: EC at 25 °C = measured EC ÷ [1 + 0.02 × (temperature − 25)], which works out to roughly 2% per degree.
The USGS table of correction factors shows how big the error gets. A reading taken at 20 °C must be multiplied by 1.11, one at 15 °C by 1.24, and one at 10 °C by 1.41 to express it at 25 °C. In practice, a solution that is truly EC 1.6 at 25 °C would read about 1.44 at 20 °C on an uncompensated meter, and about 1.29 at 15 °C. Convert that low reading from ppm to EC and you might add fertilizer the plants do not need.
Two simple habits avoid the problem: buy a meter with ATC, and take readings at a consistent solution temperature. In a deep water culture tank or any reservoir, that also tells you when the water is drifting out of its healthy range.
Calibrating so your ppm to EC numbers mean something
A conversion is only as good as the reading behind it. Bluelab’s cleaning and calibration guide recommends cleaning a conductivity probe once a month and checking it in fresh EC 2.77 standard solution, because salts, nutrients and organic oils build up on the sensor, block contact with the solution and cause drift. The USGS adds two rules that apply to any meter: never use expired standards and never reuse standard solution.
pH meters need more attention than EC meters. Missouri Extension recommends calibrating a pH meter once a week at two points, pH 4 and pH 7, and Oklahoma State says pH and EC should be checked daily in an active system.
PPM to EC mistakes to avoid
- Comparing ppm numbers from two different meters. A 500-scale pen and a 700-scale pen give different ppm for the same tank. Compare EC instead.
- Following a feed chart without knowing its scale. Reading a 700-scale chart on a 500-scale meter makes the ppm to EC result wrong and overfeeds by 40%, because 1 ppm700 point equals only 0.71 ppm500 points.
- Treating ppm as a lab result. Meter ppm is an estimate from conductivity; the true concentration of each nutrient needs a laboratory test.
- Ignoring the water you start with. Hard tap water can already read several hundred ppm before any nutrients go in.
- Measuring cold or warm solution on a meter without ATC. The temperature error alone can exceed 20%.
- Letting the probe get dirty. Residue lowers readings, which prompts overfeeding.
Where this applies
The ppm to EC formulas are universal, but the scale you meet depends on where your nutrients, meter and grow guides come from. Following Bluelab’s description, material from the USA tends to use the 500 or 650 scale, UK material the 700 scale, and Australian material any of the three, so check each source rather than assuming. Local water matters too: the starting EC of tap water varies widely between cities and between wells, so measure your own and subtract it when a recipe gives “EC above source water.” If your water is naturally high in salts, reverse osmosis or rainwater may be needed to reach low targets for seedlings and leafy greens.
PPM to EC FAQ
What EC is 1000 ppm?
Using the ppm to EC formulas: EC 2.0 mS/cm on the 500 scale, 1.54 on the 650 scale, and 1.43 on the 700 scale.
What EC is 800 ppm?
By the same ppm to EC math: EC 1.6 on the 500 scale, 1.23 on the 650 scale, and 1.14 on the 700 scale.
Is TDS the same as ppm?
On most meters, “TDS” means the ppm 500 scale. Both are estimates calculated from EC, not direct measurements of dissolved solids, so you convert a TDS reading from ppm to EC by dividing by 500.
Is EC or ppm better for hydroponics?
EC. It is the quantity the meter actually measures, it does not depend on a conversion factor, and it matches the units in extension and university recommendations.
Is mS/cm the same as dS/m?
Yes. 1 mS/cm = 1 dS/m = 1,000 µS/cm, so EC 1.5 mS/cm is also 1.5 dS/m and 1,500 µS/cm.
Once you know your meter’s scale, a ppm to EC conversion takes seconds, and switching your notes to EC removes the problem for good. For crop targets and pH ranges, browse our Nutrients, pH and EC guides.
Sources
- Prasad, L. and Meehan, M. Using Electrical Conductivity and Total Dissolved Solids Meters to Field Test Water Quality. NDSU Extension, WQ1923 (revised 2025).
- Radtke, D.B., Davis, J.V. and Wilde, F.D. Specific Electrical Conductance. U.S. Geological Survey TWRI Book 9, chapter A6, section 6.3 (version 1.2, 2005).
- Bluelab. What are the different conductivity scales? What do they mean? and Conductivity pen and probe cleaning and calibration guide.
- Dunn, B. and Singh, H. Electrical Conductivity and pH Guide for Hydroponics. Oklahoma State University Extension, HLA-6722 (2017).
- Cabrera-Garcia, J. Hydroponic Nutrient Solutions. University of Missouri Extension, G6984.
- Brechner, M. and Both, A.J. Hydroponic Lettuce Handbook. Cornell University CEA Program (2013).
Featured image: “hydroponic herb garden on the roof” by Bekathwia, CC BY-SA 2.0.