
Short answer: most leafy greens and herbs grow well at an EC of about 1.0–1.8 mS/cm, fruiting crops such as tomato, eggplant and beans want roughly 2.0–3.5 mS/cm, and nearly all hydroponic crops are kept at a pH of about 5.5–6.5. The hydroponic EC chart below gives the published EC and pH range for 20 food crops, with each range also converted to ppm on the 500 and 700 scales.
The numbers come from the Oklahoma State University Extension fact sheet on EC and pH for hydroponics, checked against Cornell, Ohio State, the University of Arizona, the University of Florida and Virginia Tech. Below the chart you will find how to convert EC to ppm, why different sources disagree, and how to use a hydroponic EC chart when you grow several crops in one reservoir.
Table of Contents
Hydroponic EC chart for 20 food crops
EC (electrical conductivity) measures how much dissolved fertilizer salt is in the water. It does not tell you which nutrients are there, only the total. The ranges in this hydroponic EC chart are from the Oklahoma State University Extension fact sheet HLA-6722 (Dunn and Singh, 2017). The two ppm columns are simple conversions (EC × 500 and EC × 700), explained in the next section.
| Crop | EC (mS/cm) | ppm, 500 scale | ppm, 700 scale | pH |
|---|---|---|---|---|
| Asparagus | 1.4–1.8 | 700–900 | 980–1,260 | 6.0–6.8 |
| Basil | 1.0–1.6 | 500–800 | 700–1,120 | 5.5–6.0 |
| Bean | 2.0–4.0 | 1,000–2,000 | 1,400–2,800 | 6.0 |
| Broccoli | 2.8–3.5 | 1,400–1,750 | 1,960–2,450 | 6.0–6.8 |
| Cabbage | 2.5–3.0 | 1,250–1,500 | 1,750–2,100 | 6.5–7.0 |
| Celery | 1.8–2.4 | 900–1,200 | 1,260–1,680 | 6.5 |
| Cucumber | 1.7–2.0 | 850–1,000 | 1,190–1,400 | 5.0–5.5 |
| Eggplant | 2.5–3.5 | 1,250–1,750 | 1,750–2,450 | 6.0 |
| Leek | 1.4–1.8 | 700–900 | 980–1,260 | 6.5–7.0 |
| Lettuce | 1.2–1.8 | 600–900 | 840–1,260 | 6.0–7.0 |
| Okra | 2.0–2.4 | 1,000–1,200 | 1,400–1,680 | 6.5 |
| Pak choi | 1.5–2.0 | 750–1,000 | 1,050–1,400 | 7.0 |
| Parsley | 1.8–2.2 | 900–1,100 | 1,260–1,540 | 6.0–6.5 |
| Peppers | 0.8–1.8 | 400–900 | 560–1,260 | 5.5–6.0 |
| Rhubarb | 1.6–2.0 | 800–1,000 | 1,120–1,400 | 5.5–6.0 |
| Sage | 1.0–1.6 | 500–800 | 700–1,120 | 5.5–6.5 |
| Spinach | 1.8–2.3 | 900–1,150 | 1,260–1,610 | 6.0–7.0 |
| Strawberry | 1.8–2.2 | 900–1,100 | 1,260–1,540 | 6.0 |
| Tomato | 2.0–4.0 | 1,000–2,000 | 1,400–2,800 | 6.0–6.5 |
| Zucchini (courgette) and marrow | 1.8–2.4 | 900–1,200 | 1,260–1,680 | 6.0 |
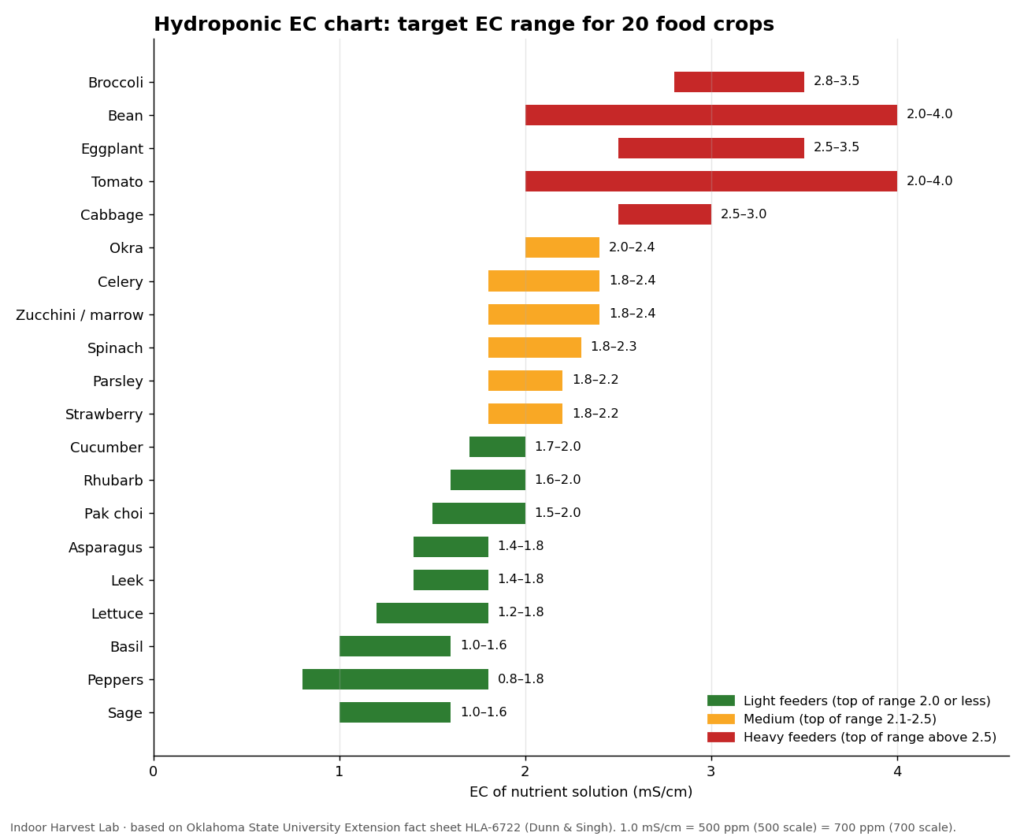
The fact sheet behind this hydroponic EC chart also lists banana (EC 1.8–2.2, pH 5.5–6.5) and four ornamentals: African violet (1.2–1.5, pH 6.0–7.0), carnation (2.0–3.5, pH 6.0), ficus (1.6–2.4, pH 5.5–6.0) and rose (1.5–2.5, pH 5.5–6.0).
Reading the colours in the hydroponic EC chart
Crops in green top out at 2.0 mS/cm or less. They are light feeders and are the easiest to grow together in one tank. Orange crops sit in the middle. Red crops (broccoli, cabbage, eggplant, bean and tomato) tolerate or need a strong solution once they are large, and they usually get their own reservoir.
How to read a hydroponic EC chart
Three details decide whether the numbers in any hydroponic EC chart match what your meter shows.
- Units. 1 mS/cm is the same as 1 dS/m and equals 1,000 µS/cm. A pen that reads “1200 µS” is showing 1.2 mS/cm.
- Total versus added EC. Most versions of a hydroponic EC chart give the EC of the finished solution. Cornell’s Cornell CEA hydroponic lettuce handbook is an exception: it sets lettuce at 1,150–1,250 µS/cm above the source water. If your tap water reads 0.4 mS/cm, the finished solution would read about 1.6.
- Ranges, not targets. Start at the low end of a range for seedlings and young plants and move up as the crop grows. The top of the range is a ceiling, not a goal.
Your water matters too. The University of Missouri Extension guide G6984 gives a typical source-water EC of 0.2–0.8 dS/m and recommends water below 1 dS/m for hydroponics. Always measure your water before you add nutrients.
Converting the hydroponic EC chart to ppm (500 and 700 scales)
Many cheap meters show ppm (parts per million) or TDS instead of EC. The meter measures EC and multiplies it by a fixed factor, and different brands use different factors. Meter maker Bluelab’s guide to conductivity scales explains that ppm 500 (also called TDS) is EC × 500, ppm 700 is EC × 700, and a ppm 650 scale also exists. The University of Arizona’s hydroponic workshop uses a factor of 640. CF, used in Australia and New Zealand, is simply EC × 10.
| EC (mS/cm) | CF | ppm, 500 scale | ppm, 640 scale | ppm, 700 scale |
|---|---|---|---|---|
| 0.5 | 5 | 250 | 320 | 350 |
| 1.0 | 10 | 500 | 640 | 700 |
| 1.5 | 15 | 750 | 960 | 1,050 |
| 2.0 | 20 | 1,000 | 1,280 | 1,400 |
| 2.5 | 25 | 1,250 | 1,600 | 1,750 |
| 3.0 | 30 | 1,500 | 1,920 | 2,100 |
The practical rule: 1,000 ppm on a 500-scale meter is the same solution as 1,400 ppm on a 700-scale meter. If a feeding chart lists ppm without saying which scale, you cannot use it safely. Bluelab recommends working in EC for exactly this reason, and so does this hydroponic EC chart. For full ppm-to-EC tables, how to find your meter’s scale, and how temperature skews readings, see our PPM to EC conversion guide.
Why every hydroponic EC chart gives different numbers
If you compare any two versions of a hydroponic EC chart online, the numbers rarely match. Lettuce shows the problem clearly: five reputable sources give five different answers.
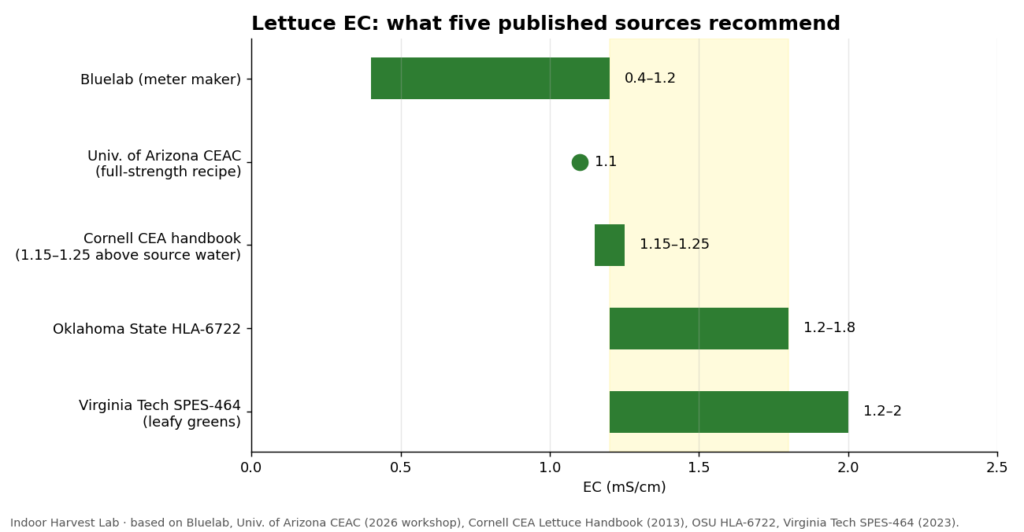
- Oklahoma State: 1.2–1.8 mS/cm.
- The University of Florida IFAS guide HS1422 on small hydroponic systems: 1.4–1.8 mS/cm, pH 6.0–7.0.
- The Virginia Tech deep water culture publication SPES-464: many leafy greens perform well at 1.2–2.0 mS/cm.
- The University of Arizona CEAC nutrient solution workshop: a full-strength lettuce recipe at 1.1 mS/cm, and 1.0–2.0 as the commonly used range.
- Bluelab’s crop list: 0.4–1.2 mS/cm.
The reason is that plants tolerate a wide band. A greenhouse trial reported in Greenhouse Grower on EC for hydroponic basil found comparable basil growth across nutrient solutions from 0.5 to 4 mS/cm, while doubling the daily light (from about 7 to about 15 mol/m²/day) improved growth significantly. For most home growers, light and root health limit yield long before the exact EC does.
How to use the hydroponic EC chart step by step
- Measure your source water. Note its EC and pH. If the EC is above 1.0 mS/cm, consider filtered or rain water.
- Pick the target. Find your crop in the hydroponic EC chart. For seedlings and new transplants, aim for the bottom of the range, or about half strength. Arizona’s lettuce example uses 0.5 mS/cm for half strength and 1.1 mS/cm for full strength.
- Add nutrients in small steps. Add part of the concentrate, stir well, and read the meter. Repeat until you reach the target. If your fertilizer has two parts (A and B), add each one separately to the water, never to each other.
- Adjust pH last. Oklahoma State advises that pH should always be checked after the EC is in the optimum range. Bring it into the 5.5–6.5 band with pH down or pH up (see how to lower pH in hydroponics for doses and safety).
- Check regularly. Oklahoma State recommends checking pH and EC daily; Virginia Tech suggests two to three times a week for deep water systems. Small home setups usually sit in between.
- Top up or replace. Add plain water when EC climbs and a weaker solution when it falls. Replace the whole solution when it gets cloudy, smells, or drifts far from the target. Check the hydroponic EC chart again when the crop moves from seedling to mature plant.
For a system that is filled once and never adjusted, see how the Kratky method sets EC on day one. For an aerated tank, our guide to deep water culture for beginners covers daily checks. More posts on feeding are in the hydroponic nutrients, pH and EC section.
pH ranges that go with the hydroponic EC chart
EC tells you how much fertilizer is in the water; pH decides how much of it the roots can take up. Oklahoma State notes that nutrient solutions for soilless culture should usually be pH 5 to 6 (often 5.5), so that the root environment stays around 6 to 6.5. Ohio State’s greenhouse tomato fact sheet puts the range where most nutrients are highly available at 5.5 to 6.5. Arizona gives 5.6–6.3 as the commonly used range, and the Cornell lettuce handbook treats 5.8 as optimum.
A few pH values in the Oklahoma State list sit outside that band, such as pak choi at 7.0 and cucumber at 5.0–5.5. If you grow several crops in one reservoir, keep the solution at 5.5–6.5 and do not chase the individual numbers.
EC changes as plants grow: the tomato example
Fruiting crops are fed more strongly as they mature. This is why a tomato row in any hydroponic EC chart spans 2.0–4.0 mS/cm.
| Tomato stage | Arizona CEAC EC | Arizona CEAC pH |
|---|---|---|
| Propagation (0–4 weeks) | 1.0 mS/cm | 6.0 |
| Vegetative (4–8 weeks) | 1.5 mS/cm | 6.0 |
| Generative (8–12 weeks) | 1.9 mS/cm | 5.6 |
| Production (12+ weeks) | 2.2 mS/cm | 6.0 |
The Ohio State University fact sheet HYG-1437 on tomato nutrient solutions uses a similar pattern: about 2.0 dS/m in stage 1 and closer to 2.4 dS/m in stage 3. It also notes that these values may rise when the source water already contains salts.
Hydroponic EC chart mistakes to avoid
- Mixing up ppm scales. A 700-scale number used on a 500-scale meter makes the solution about 40% too strong.
- Feeding seedlings at the top of the range. Young roots burn easily; begin low and step up.
- Adjusting pH before EC. Adding nutrients shifts pH, so the pH you set first will not hold.
- Treating EC as a full nutrient test. The Arizona workshop puts it plainly: EC does not tell you about specific ions. A solution can have the right EC and still lack calcium or magnesium if the fertilizer is incomplete.
- Chasing numbers from every hydroponic EC chart you find. Pick one reputable source per crop and stay consistent.
- Using an uncalibrated meter. Missouri Extension recommends calibrating a pH meter weekly at pH 4 and pH 7, and notes that pH probes last about 1–2 years and EC probes about 2–5 years.
Where this applies
The EC ranges in this hydroponic EC chart apply to indoor and greenhouse systems anywhere, but three local factors shift how you use them. Treat the hydroponic EC chart as a starting point and adjust to your conditions. First, source water: hard water can already carry a good share of your target EC, while soft or filtered water starts near zero. Second, heat: plants drink more water relative to nutrients in warm rooms, so EC tends to climb between checks; Oklahoma State considers 72–75 °F (22–24 °C) water optimal, and UF/IFAS advises keeping the solution between 65 and 80 °F. Third, meters: ppm scales differ between regions and brands, so read your meter’s manual before using any ppm figure.
Hydroponic EC chart FAQ
What is a good EC for hydroponic lettuce?
The hydroponic EC chart above gives lettuce 1.2–1.8 mS/cm, and most extension sources fall between about 1.1 and 1.8 mS/cm for finished lettuce solution. Start near 1.2 and stay below 2.0.
Is EC the same as ppm?
No. EC is what the meter measures; ppm is EC multiplied by a factor (500, 640, 650 or 700 depending on the meter). EC is the same everywhere, which is why this hydroponic EC chart uses it.
Why does my EC keep rising?
Plants are taking up water faster than nutrients, so the salts concentrate. Top up with plain water. If EC falls instead, the plants are feeding heavily; top up with a weak nutrient solution.
Can I grow crops with different EC needs in one system?
Yes, if their ranges overlap. Lettuce, basil, pak choi and asparagus all overlap around 1.5 mS/cm. Tomatoes (2.0–4.0) and lettuce (1.2–1.8) do not overlap at all, so they need separate tanks.
Sources
- Dunn, B. and Singh, H. Electrical Conductivity and pH Guide for Hydroponics, HLA-6722. Oklahoma State University Extension, 2017.
- Brechner, M., Both, A.J. and CEA staff. Hydroponic Lettuce Handbook. Cornell Controlled Environment Agriculture, 2013.
- Kroggel, M. and Kubota, C. Hydroponic Nutrient Solution for Optimized Greenhouse Tomato Production, HYG-1437. The Ohio State University.
- University of Arizona CEAC. Module 3: Hydroponic Nutrient Solutions (workshop slides), 2026.
- Sandoya, G.V. et al. Growing Lettuce in Small Hydroponic Systems, HS1422. UF/IFAS Extension, 2021.
- Mullins, Vallotton, Latimer, Sperry and Scoggins. Hydroponic Production of Edible Crops: Deep Water Culture (DWC) Systems, SPES-464. Virginia Cooperative Extension, 2023.
- Cabrera-Garcia, J. Hydroponic Nutrient Solutions, G6984. University of Missouri Extension.
- Bluelab. What are the different conductivity scales?
- Greenhouse Grower. Managing Electrical Conductivity (EC) for Hydroponic Basil Production.
Featured image: “Green City Growers Tour 062 by AR (29)” by MMW Horticulture Group, CC BY 2.0.